
The Application of Voronoi Diagram into the Space Planning for Urban Design
Jongjin Park1, Seoungyeul Ji2, Eonyong Kim3 and Hanjong Jun4
1Graduate Student, Department of Architecture, Hanyang University, Korea
2Researcher, BIMRC (BIM Research Centre), Hanyang University, Korea
3Ph.D. Candidate, Department of Architecture, Hanyang University, Korea
3Associate Professor, Department of Architecture, Hanyang University, Korea
------------------------------------------------------
Abstract
This paper presents the unique formation technique of a given area with the support of a digital algorithm developed by Voronoi diagram for the effective distribution of city blocks. By merging systematic parameters of urban situations with digital parametric tools, the interaction and relationships of urban blocks are enhanced through balancing of the spatial structure of the city. The paper discussed how the parametric distributing and zoning system by Voronoi diagram allows the designers to create an innovative urban design language. With the in-depth research on the international waterfront design competition, Magok waterfront design competition, the approaches to the application of Voronoi diagram into urban design process are clarified to be an effective, creative and successful digital tool. The result of the application of the Voronoi diagram improves the design qualities in the sense that it enhances the accessibility of visitors of the site to all the key places in the area, makes district blocks to have more interactive and dynamic relationships, establishes the systematic design process for urban design using parametric system, restores the equilibrium of forces and tensions among blocks, and suggests diverse design alternatives in a balanced hierarchy system.
Keywords: Urban Design, Voronoi Diagram, Digital Architecture, Parametric Design Tool
-----------------------------------------------------------------
1. Introduction
Architecture has focused its universal attention on a city since the modern age. Infusing the urban contexts into the architecture, architects were dealing with various spaces of a city such as roads, squares and buildings.
In current practices, much attention is focusing on the qualitative aspects of the city in order to improve the affluence and amenities of the urban environment as a place of living. Thus, more and more researches are conducted to study comprehensively and systematically the urban environment which consists of public infrastructure and private buildings.
The formation of a city is not just in the physical form. It consists of an organized structure that can be changed, modified, and deformed. Therefore, the city should not be just physically defined any more. Instead, it is demanded for the architecture to follow the new trends of the city as new urban forms are discovered and studied.
In the digital architecture, various attempts are made to overcome the physically fixed limitations that a space has, and to accept numerous information and needs from the architectural environment. Voronoi diagram, a mathematical and geometrical system, is one of such attempts.
Voronoi theory is the process-oriented design methodology that creates the evolutionary space and form with the support of computer programming. In this paper, we aim for a new spatialization system of a city as an organic integration using Voronoi diagram during the space planning phase of the urban design process.
In Section 2, we survey the theoretical background of the Voronoi diagram and its characteristics by searching online and offline documentations. Also, we analyze its process of pattern making in relation to the formation of the diagram and the symbolic values involved within the Voronoi Theory.
Section 3 presents the case studies of the practical applications of Voronoi Diagram in Architecture. In Geographic Information System (GIS), interior design, and skin design of a building, Voronoi diagram is effectively used as a means to construct a spatial division model, resulting in better perception and comprehension of the given space. The main concern of this section is to review the applicability of Voronoi diagram in the other architectural practices, as well as to predict the potentialities of the Voronoi diagram in Urban Design, which is followed in Section 4.
By reviewing the process and the effectiveness of Voronoi diagram from the project in Section 4, we can analyze the potential of the parameter-based diagram system in the urban zoning process.
2. History and Nature of Voronoi Diagram
2.1. Background of Voronoi Diagram
In mathematics, a Voronoi diagram, named after Georgy Voronoi, also called a Voronoi tessellation, a Voronoi decomposition, or a Dirichlet tessellation (after Lejeune Dirichlet), is a special kind of decomposition of a metric space determined by distances to a specified discrete set of objects in the space, e.g., by a discrete set of points. [1]
It is the technique that enables the division of such multi-dimensional spaces into subspaces. Its application defines geometric areas equivalent to subspaces by defining several vectors as centres of subspaces. Any other vector in space can then be attributed to the closest centre vector effectively dividing the whole space in subspaces, thus an excellent choice to divide semantic vector spaces. [2]
Aurenhammer [3] describes Voronoi Tessellation as “one of the most fundamental data structures in computational geometry” which are used to model natural phenomena, to investigate “their mathematical, in particular, geometrical, combinatorial, and stochastic properties” and their computational representation. It also offers various methods for clustering of multi-dimensional data.
Voronoi has been applied for a file compression of CAD and CAM, as well as for the mathematical calculation of molecular structures in the micro- technology. By extension, it is possible to be evolved as a means to explain the tangible natural phenomenon and non-tangible social phenomenon. In addition, since Voronoi diagram has its roots in the geometrical structure, it has much more to do with the space formation.
Voronoi diagram aims for a system communicating and responding actively to the properties and the changes of the surroundings to which the space itself belongs. Architecture creates a space with the complexity of the society and the nature by collecting information surrounding it in order to seek a solution for architectural requirements. Thus, Voronoi theory can enhance the applicability of the computer technology to the architecture with the support of information that deals with the change, adaptation, and modification of a space. [4]
2.2. Composition of Voronoi Diagram
The implementation of the Voronoi diagram, a space-filling topological structure, simulates the natural information exchange of particles in the architectural environment, and it also subdivides the whole space into a set of sub-regions according to the data of the objects.
The Voronoi diagram consists of Voronoi Cell, Voronoi Vertex, Voronoi Foam, and Voronoi Space. Figure 1 shows the main composition of the Voronoi diagram.
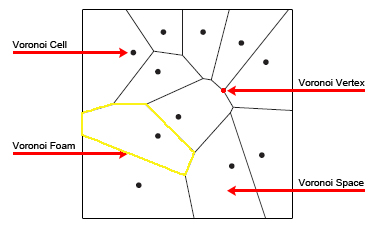
Fig. 1. Composition of Voronoi Diagram
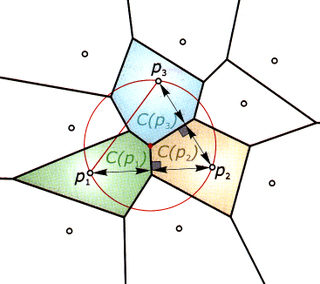
The Voronoi diagram of a point set p1, p2, …, pN decomposes the plane into nearest-neighbour regions, called Voronoi cells C(p1), C(p2), …, C(pN). The Voronoi cell C(pi) of a point pi contains all points of the plane that are closer to pi than to any other input point. Voronoi cells are convex. [5]
2.3. Nature of Voronoi Diagram
2.3.1. Way Finding
The Voronoi diagram was implemented as the background information into navigation, especially way finding. In order to find the shortest way from object “A” to object “B”, all boundary vertices of “A” ask their neighbours outside their personal space and they ask their neighbours and so on till they find “B”. This search approach evolves a network of interlinked tree-structures. The path between “A” and “B” can then be drawn by following the branches of the network. By now the path is “as the crow flies” and has to be corrected to the space in between the objects. [6]
2.3.2. Occupation Analyses
Another application of the Voronoi diagram is in the occupation analyses of a space. In this case the centre of Voronoi cells becomes the search agents that receive information of the surrounded cells during the searching process. When the information from the surrounded cells fits their inherent requirements, the agent holds the space.
2.3.3. Space Evolution
The Voronoi diagram activates a process of generating and evolving spatial forms interacting with all entities of a system, the self-organization. It leads to the evolution of the system continuously proliferating with the spatial pattern defined from the self-organization. In the context of the architecture, it would be referred to the co-adaption which generates a space out of complex relationships and needs among disorganized subsystems of the environment.[6]
3. Case Studies of Architecture Practices using the Voronoi Diagram
In this section, the practical applications of Voronoi Diagram, especially in architecture, are presented and analyzed based on case studies.
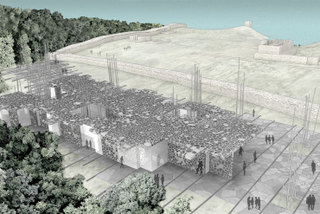
3.1. National Kaohsiung Performance Arts Centre
The competition entry for National Kaohsiung Performance Arts Centre, designed by Zaha Hadid, uses the Voronoi diagram for the analysis of the relationships of the data from the surrounding environment and the site. With the information from the site conditions such as trees, monuments, and boundaries, the access points of visitors are controlled, and then the region of the point clouds, which are created by analyzing the link and the relation between the space and the site, is connected to the main flow of human traffic so that it becomes a means to control the traffic of the space.
The deformation of visual data drawn from the Voronoi diagram is also applied to the design of canopy, façade, and roof of the building itself.
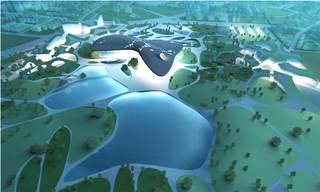
Fig. 3. Voronoi diagram used for the site design of NKPAC competition entry
3.2. Tulum Museum
The competition entry, designed by Andrew Kudless, for an archaeological museum outside a Mayan ruin on the Cancun peninsula is the project that researches into cellular aggregate structures with the Voronoi system. The museum walls and roofs are composed of a 3D Voronoi tile system which explores the nature of aggregate structures through voids rather than mass. The structure relates directly to the stone aggregate walls of the Tulum site: the structure could be considered as the materialization of the voids between the individual stones. Thus, the museum structure refers to the existing tectonic yet renders it lightweight and airy. It is invisible made visible. [7]
3.3. Net.Lab
Net.Lab is the 16 months research project carried out by G_Nome. The research is focused on how algorithms can be applied parametrically in the formation of cellular spaces in relation to specific contingent criteria articulating a variety of social systems, scales, and users’ needs. Net.Lab includes a series of computational procedures based on the Voronoi algorithm summarized in a plug-in generated during the research which allows an iterative process of feedback, adjustment, and optimization of the design brief. Besides, the project explores the redefinition of the architect’s role by integrating design, analysis, and production-manufacturing as a whole formal process by applying algorithms in real contexts. [8]
4. Potentiality of Voronoi diagram in Urban Design
In this section, we look into the project which uses the Voronoi system for dividing the given district of Seoul city for the international design competition. Although this competition was limited to a specific region within the city, it has great potential for the expansion of the application of the Voronoi system into the urban design.
The main concept of this project, the International Design Competition for the Magok Waterfront City, is to merge the flow of the landscape with the logic of the Voronoi diagram since the designer becomes increasingly interested in the efficient use of ecosystem and water flow.
The historical urban grid, which has been used over half a century in the site, causes the segmentation of the functional communication among blocks of the city. Using Voronoi diagram, this problem can be solved by breaking the physical limits of the urban grid. Moreover, it accepts the numbers of information and needs from the architectural environment.
4.1. Process of Overlapping preliminary design with Voronoi diagram
Urban design is not just a single simple work, it consists of various professional disciplines such as architectural design, engineering work, landscape, and infra structure. In this project, a new layer is created to integrate the movement and the flow of the site, which plays a critical role in linking interactions from each context.
In this project, we make the systematic rule that can organize the space into a flexible and soft city. The space should accept various activities and events reflecting the concept. And through the analysis, we reach the conclusion that we should make a reservoir space for the safe city in case it gets a flood. Therefore, we make a condition based on the data from we investigate, and extract two main concerns from our analysis; the relationship and the volume of spaces.
For the digital parametric process of the project, we apply Chris Gold [9]’s process, which applies the Voronoi diagram for dynamic cartography, and modifies it in order to fit our project’s concept. In addition, we use the Voronoi diagram plug-in offered as Rhinoscript from David Rutten [10]’s website.
The first step of the project is to set up the axis of the site drawn from the flow of landscape, water, and traffic in order to create the grids of the site. These grids are optimized by offsetting by 50m from the axis and are used as the limitation of the block size (Fig. 7-ii). The basic input points for the Voronoi diagram are extracted from the intersections between these grids and the preliminary sector design, and are set in array according to the flow of the whole space (Fig. 7-iii).
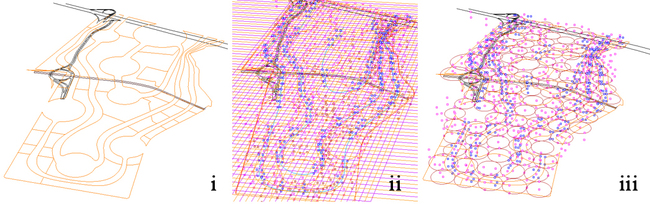
Fig. 6. Formation of the Basic Input Points
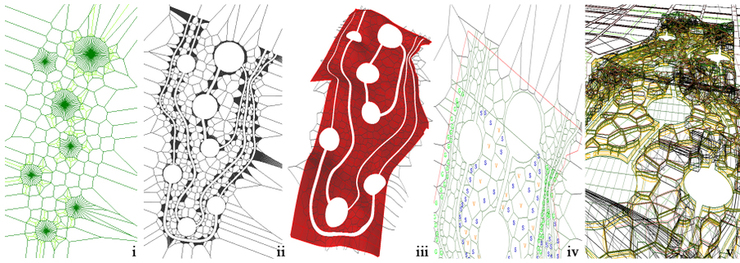
Fig. 7. Process of the application of the Voronoi diagram for space planning
Then, by Rhinoscript, the line segments of the Voronoi diagram are created with those points (Fig. 8-i). The segments cannot be eliminated, but can only be expanded or shrunk, since collision detection and topology maintenance are based on the primary input points (Fig. 8-ii). Figure8-iii shows the line segments are laid over the contour map in 3 dimensional. Both the points and line segments forming the contours are block objects of this project. This project is directly editable due to the parametric system of the geometry creating system.
After the sub-regions are defined, the designer places Solid, Void and Green spaces in the site according to the space program and the site conditions in order to improve the accessibility of visitors to the water places (Fig. 8-iv). The locations of solid, void and green spaces determine the locations and the masses of the buildings, water bowls, and park areas (Fig. 8-v).
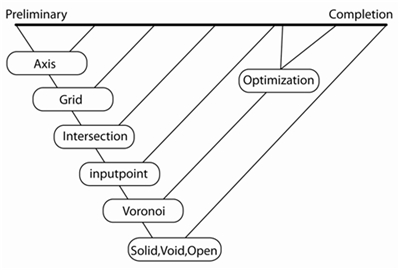
Fig. 8. The overall design process of the project
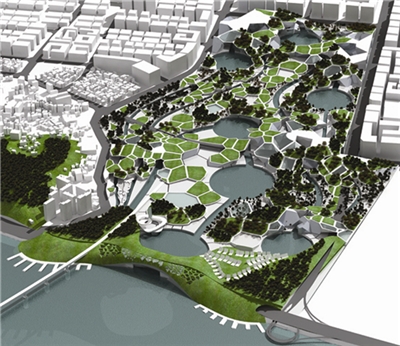
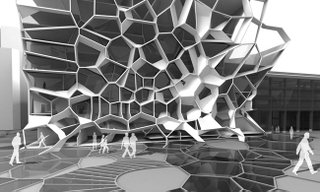
Fig. 9. Perspective view of the project final
4.3. Advantages of the Voronoi System
The space in the city is formed by the relationship among urban blocks. The consequent structure of the project reflects the functions through mutual relation of each block. Therefore, the distances and sizes of each block, analyzed by Voronoi Diagram, visually represent their relationships. The mathematical algorithm arranges the control points in order to organize the area according to the relations of the points. Furthermore, the composition of sub-regions is able to be changed systematically due to the parametric system.
5. Conclusions
Architecture is increasingly becoming a simulation rather than a representation of space through simulating phenomena of space, material, light, wind, sound, sound, inhabitants, or contour. The study of architecture therefore has to consider simulation as a powerful design tool in order to understand and implement complex relationships of the factors from the environment.
As such, urban design is becoming more complex than before. The application of Voronoi diagram is clarified from the Magok project that the tendency towards equilibrium along the city blocks is manifested in the process of self-organization conducted by the use of the Voronoi system. The result of this unique process in zoning a city is to form a nature-resembled structure of the urban area, not in the sense of a random shape as we commonly perceive form to be, but as equilibrium between the relationships of entities. The advantages of the application of the Voronoi diagram can be summarized as follows;
1) Enhancement of the accessibility of visitors to all the key places in the area.
2) More interactive and dynamic relationships of blocks.
3) Establishment of the systematic design process for urban design using parametric system.
4) Equilibrium of forces and tensions among blocks
5) Diversity of design alternatives in a balanced hierarchy system.
The results of Magok project shows a promising first step in the applicability of the Voronoi diagram in urban planning although it was limited to a district within Seoul city. Further studies are demanded to expand the concept and the effectiveness of the Voronoi system in order to apply it for a city as a whole.
6. Acknowledgement
This research was conducted with the support of Sustainable Architecture Professional Education Center (SAPEC), Brain Korea 21, Hanyang University, Korea. We especially thank to Jaekyung Lee, Designersfinger Lab. for his in-depth co-work and support on Magok project.
2) http://www.semantikoz.com/2008/02/28/voronoivoronoy-tessellation
3) Aurenhammer, F. (1991) Voronoi diagrams - a survey of a fundamental geometric data structure. ACM Comput. Surv. 23(3), 345-405.
4) Kang, Ka-Ae and Yoon, Jae-Eun (2008) A Study on the Application of the Voronoi Diagram on Digital Space. Journal of Korean Institute of Interior Design, 17(3), 156
5) Helmut P, Andreas A. Michael H. Axel K. (2007) Architectural Geometry. Bentley Institute Press, 615
6) Paul Coates, Christian Derix. (2005) Generating architectural spatial configurations. Two approaches using Voronoi tessellations and particle systems. 8th Generative Art Conference GA2005
10) Chris Gold, Maciej Dakowicz. (2007) Dynamic Cartography Using Voronoi/Delaunay Methods, ISPRS Workshop on Updating Geo-spatial databases with Imagery & The 5th ISPRS Workshop on DMGISs
Keep up the topic that everyone can choose one of the best On Coworking Space Melbourne. Thanks.
ReplyDeleteinformatica training online
ReplyDeleteinformatica course online